-
Start Date:
- January 15, 2006
-
Type of Project:
-
Theme of Project:
-
User group:
-
Project Scale:
-
Project Area:
- New York City
-
Funding:
-
Other Tags:
-
Location Description:
USA
Story created by Green Map NYC on March 1, 2021
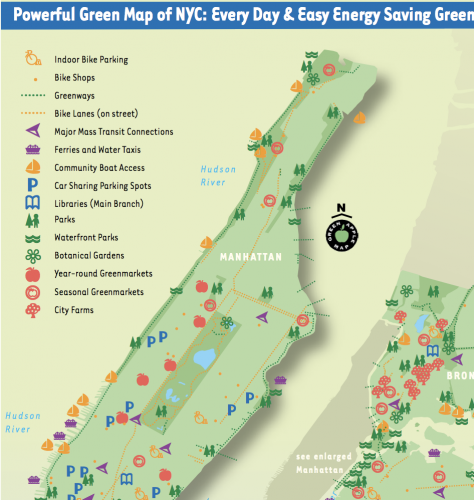
Although this Green Map was published more than a decade ago, it's a featured story because it led to so much! Not only did it give New Yorkers a sense of momentum about our progress toward energy efficiency and renewables, it also illuminated the threat of climate change (using data from Columbia University's Earth Institute). Now on the new Green Map Platform, this map also provided an example that encouraged other Green Map projects to address these issues.
Dreamt up during the Great Northeast Blackout of 2003, three years of research went into the map. To clarify this complex topic, we separated it into three views: reasons we need to act now, everyday and easy, and energy investments. We distributed 100,000 print copies, starting in January 2006.
Download the Powerful Green Map PDF (linked). We created community educational resources and events, as described in the slideshow below.
In 2009, we began adding the data to the then new Open Green Map platform, and made it interactive. After Superstorm Sandy in 2012, we added the high water mark of the flooding, which did indeed impact the infrastructure and coastal areas as the map predicted.

We continued creating iterations of this map, with events, media and more, winning Creative Climate Awards and other recognition for this work.
Of special interest to Green Map System's neighbors is the Lower East Ride Green Map, which promotes bicycling as a climate countermeasure with local impacts. This map highlights East River Park, which has a great greenway for commuting and beginning riders alike (find out more about the East Side Coastal Resilience and community opposition to the City's plan at eastriveralliance.org.